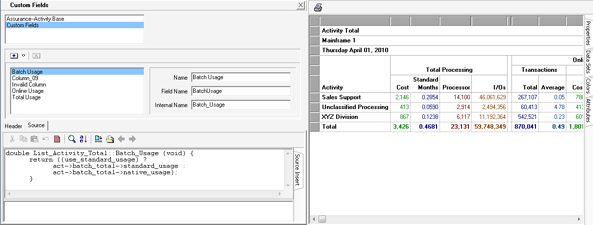


The report mechanism is the primary vehicle for the communication of information outside of RG
Solutions®. The processing has a WYSIWYG designer that is used for the development of reports
and publication. Resulting reports can be viewed internally, published manually or automatically, or
can copied and edited as new reports within a User Collection.
|
|
Major Data Features |
|
Chart
|
This is a report that contains information presented in the form a simple or
complex chart. The user has extensive options for the creation of charts.
|
List
|
This is a report that contains item information about a series of records. Each row
in the list represents a single record entry (summary or container data).
|
Group
|
This type of report contains item information about data this split into row and
column elements. It can add values to the reported fields for duplicate incoming
records. This report allows for the summarization and comparison of similar items.
|
Table
|
This is a report that contains item information about a single record. While this
report can be created for Detail Information, it is more commonly used for
Summary Information.
|
Publication
|
A publication is a compendium of reports. The output of the processing can either
be the native report output, or the compilation of all the reports into a single pdf.
|
Major Processing Capabilities
|
|
WYSIWYG
Design
|
Report design is done using a WYSIWYG design environment. If the report design
is being done from within a processing entity, then the report design will use live
data if it is available.
|
Data Scope
|
Can span multiple data sets and allows for the combining of different days, week,
repositories, services, etc. The scope is dynamic and limits on the data selection
can be imposed. Incoming records can be selected and filter to inclusion.
|
Parameters
|
The parameters are used to control the report processing in a simplified manner.
The parameters are built into the report design and allows for a single report to
produce several different outputs.
|
Dynamic
Attributes
|
Can detect locations in the text that requires the insertion of attribute information
that is associated with the processing entity. There is a large number of attributes
that can be used for the formatting of dynamic information.
|
Charting
Options
|
The chart processing provides for 2D/3D formats, 63 chart styles, 54 math
functions, 46 chart tools, themes, 6 types of axis definitions, 4 types of titles, and
dynamic legends and panels, and many more options.
|
Custom Code
|
The processing allows for the user to include custom code for the formation of
data or processing control. The processing uses a C++ dialog editor for its custom
code design.
|
Output Types
|
Chart: PDF, Printer, Bitmap, Flex (Flash), GIF, JPEG, Meta File, PCX, PNG, Post
Script, SVG, VML (HTML), VRML 3D, and XAML. Others: Delimited Spreadsheet,
Delimited Text, HTML, PDF, and Printer type output.
|
Report
Viewing
|
The processing has the ability to create and view the reports internally as part of
the Data Viewing. The viewed reports can be modified and created as part of the
viewing process.
|
Post Create
Processing
|
The processing has the ability to initiate an independent task that is started when a
report has been created and is stored on disk.
|